The icing
season,
quantified.
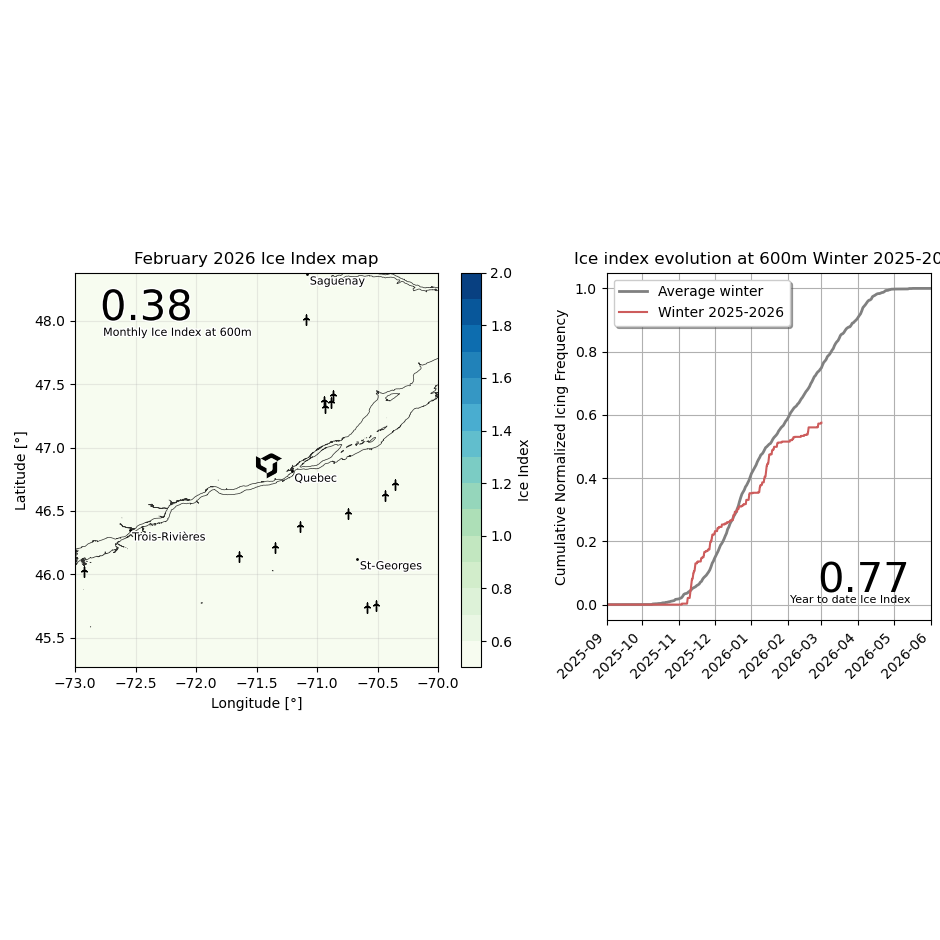
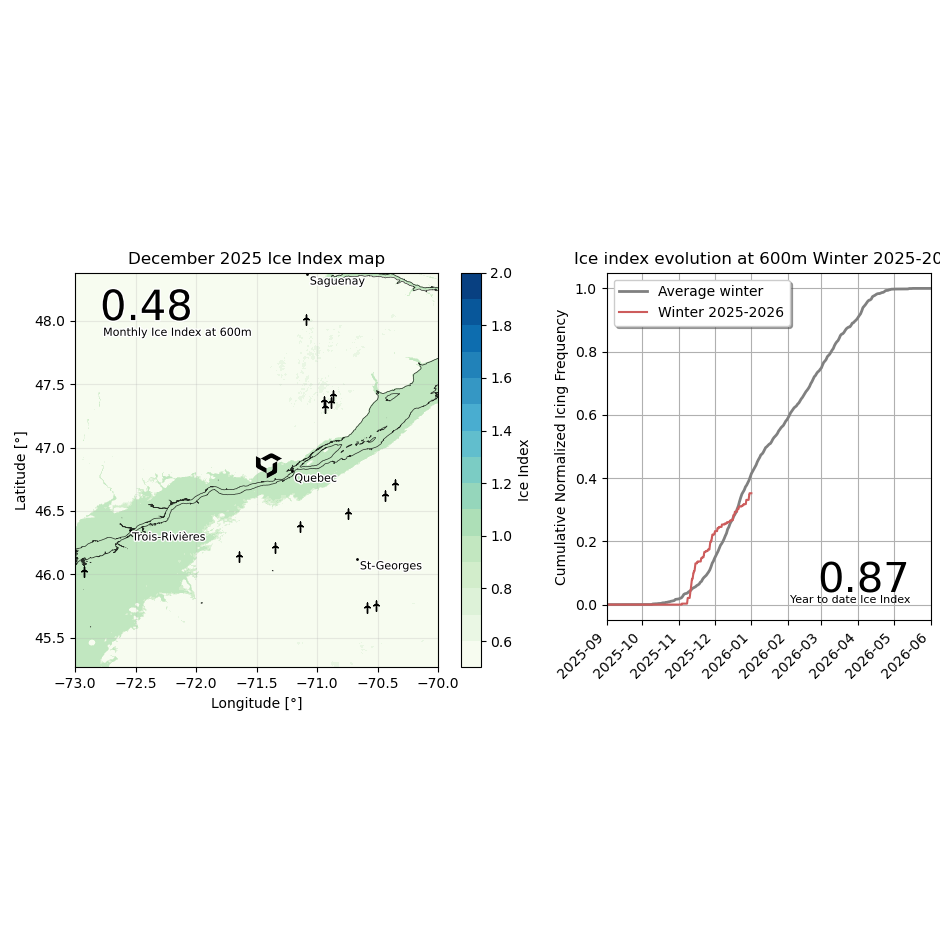
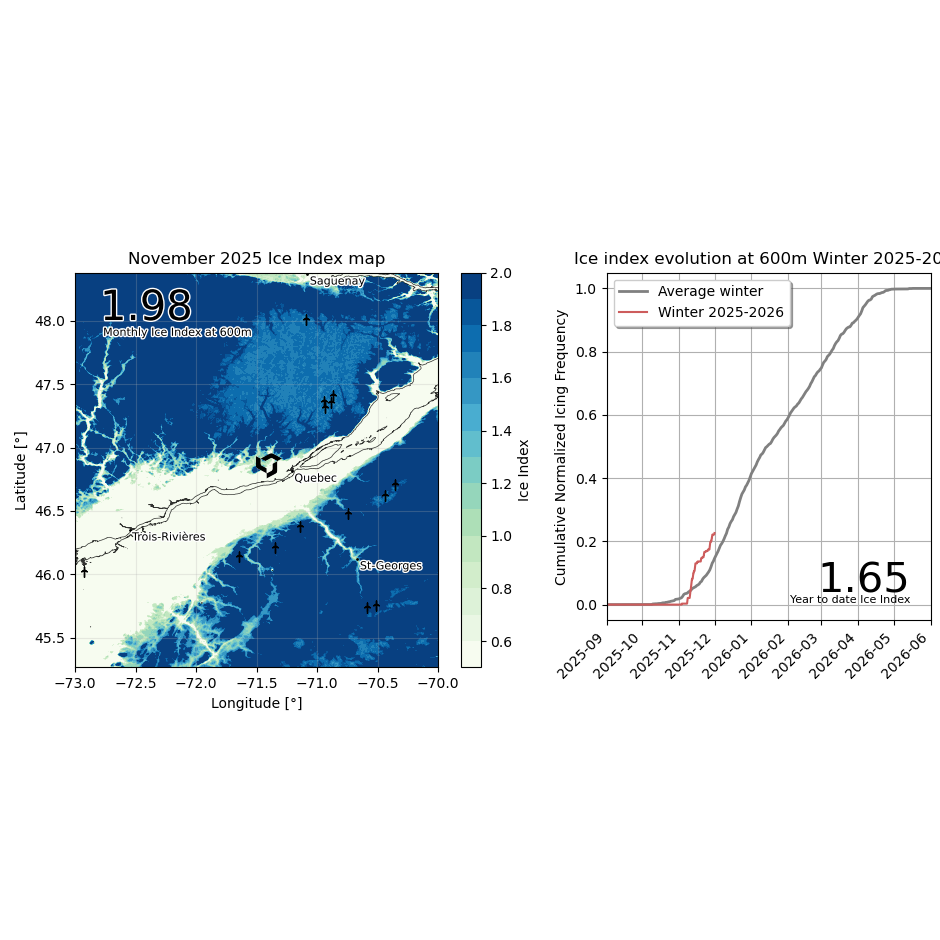
Every month we publish a normalized icing index for the region around Quebec City. Operators use it to benchmark the performance of their icing solutions, calibrate AEP forecasts, and justify investment in icing mitigation.
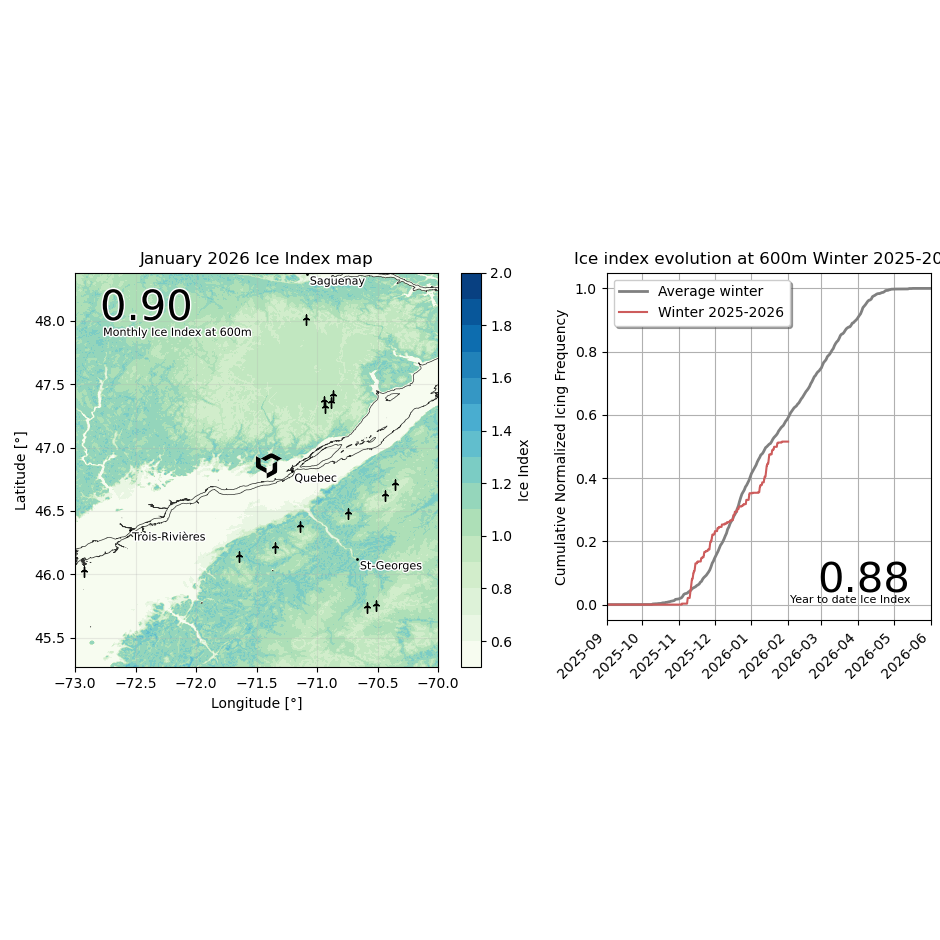
How the index is built.
L'indice de glace est un chiffre unique et comparable, établi à partir d'années de mesures météorologiques, de validations sur le terrain et de normalisation statistique.
Chaque mois, depuis 2023.
Cliquez sur un mois pour consulter son rapport complet. Les archives remontent à quatorze hivers, ce qui en fait la série de données sur le givrage la plus complète accessible au public pour l'Est du Canada.
Commission an
Ice Index for
your region.
We publish the Québec City Ice Index monthly. For other regions (New England, the Maritimes, Northern Europe, the Alps) we build and deliver a custom monthly index on commission, with much higher resolution.
Typical engagements are annual subscriptions for operators with assets in a specific area; we calibrate the model with your sensor data if you have it.
Foire aux questions.
Plan winter, not just survive it.
Subscribe to the Québec Ice Index, or commission one for your own region. We respond within 24 hours.