The icing
season,
quantified.
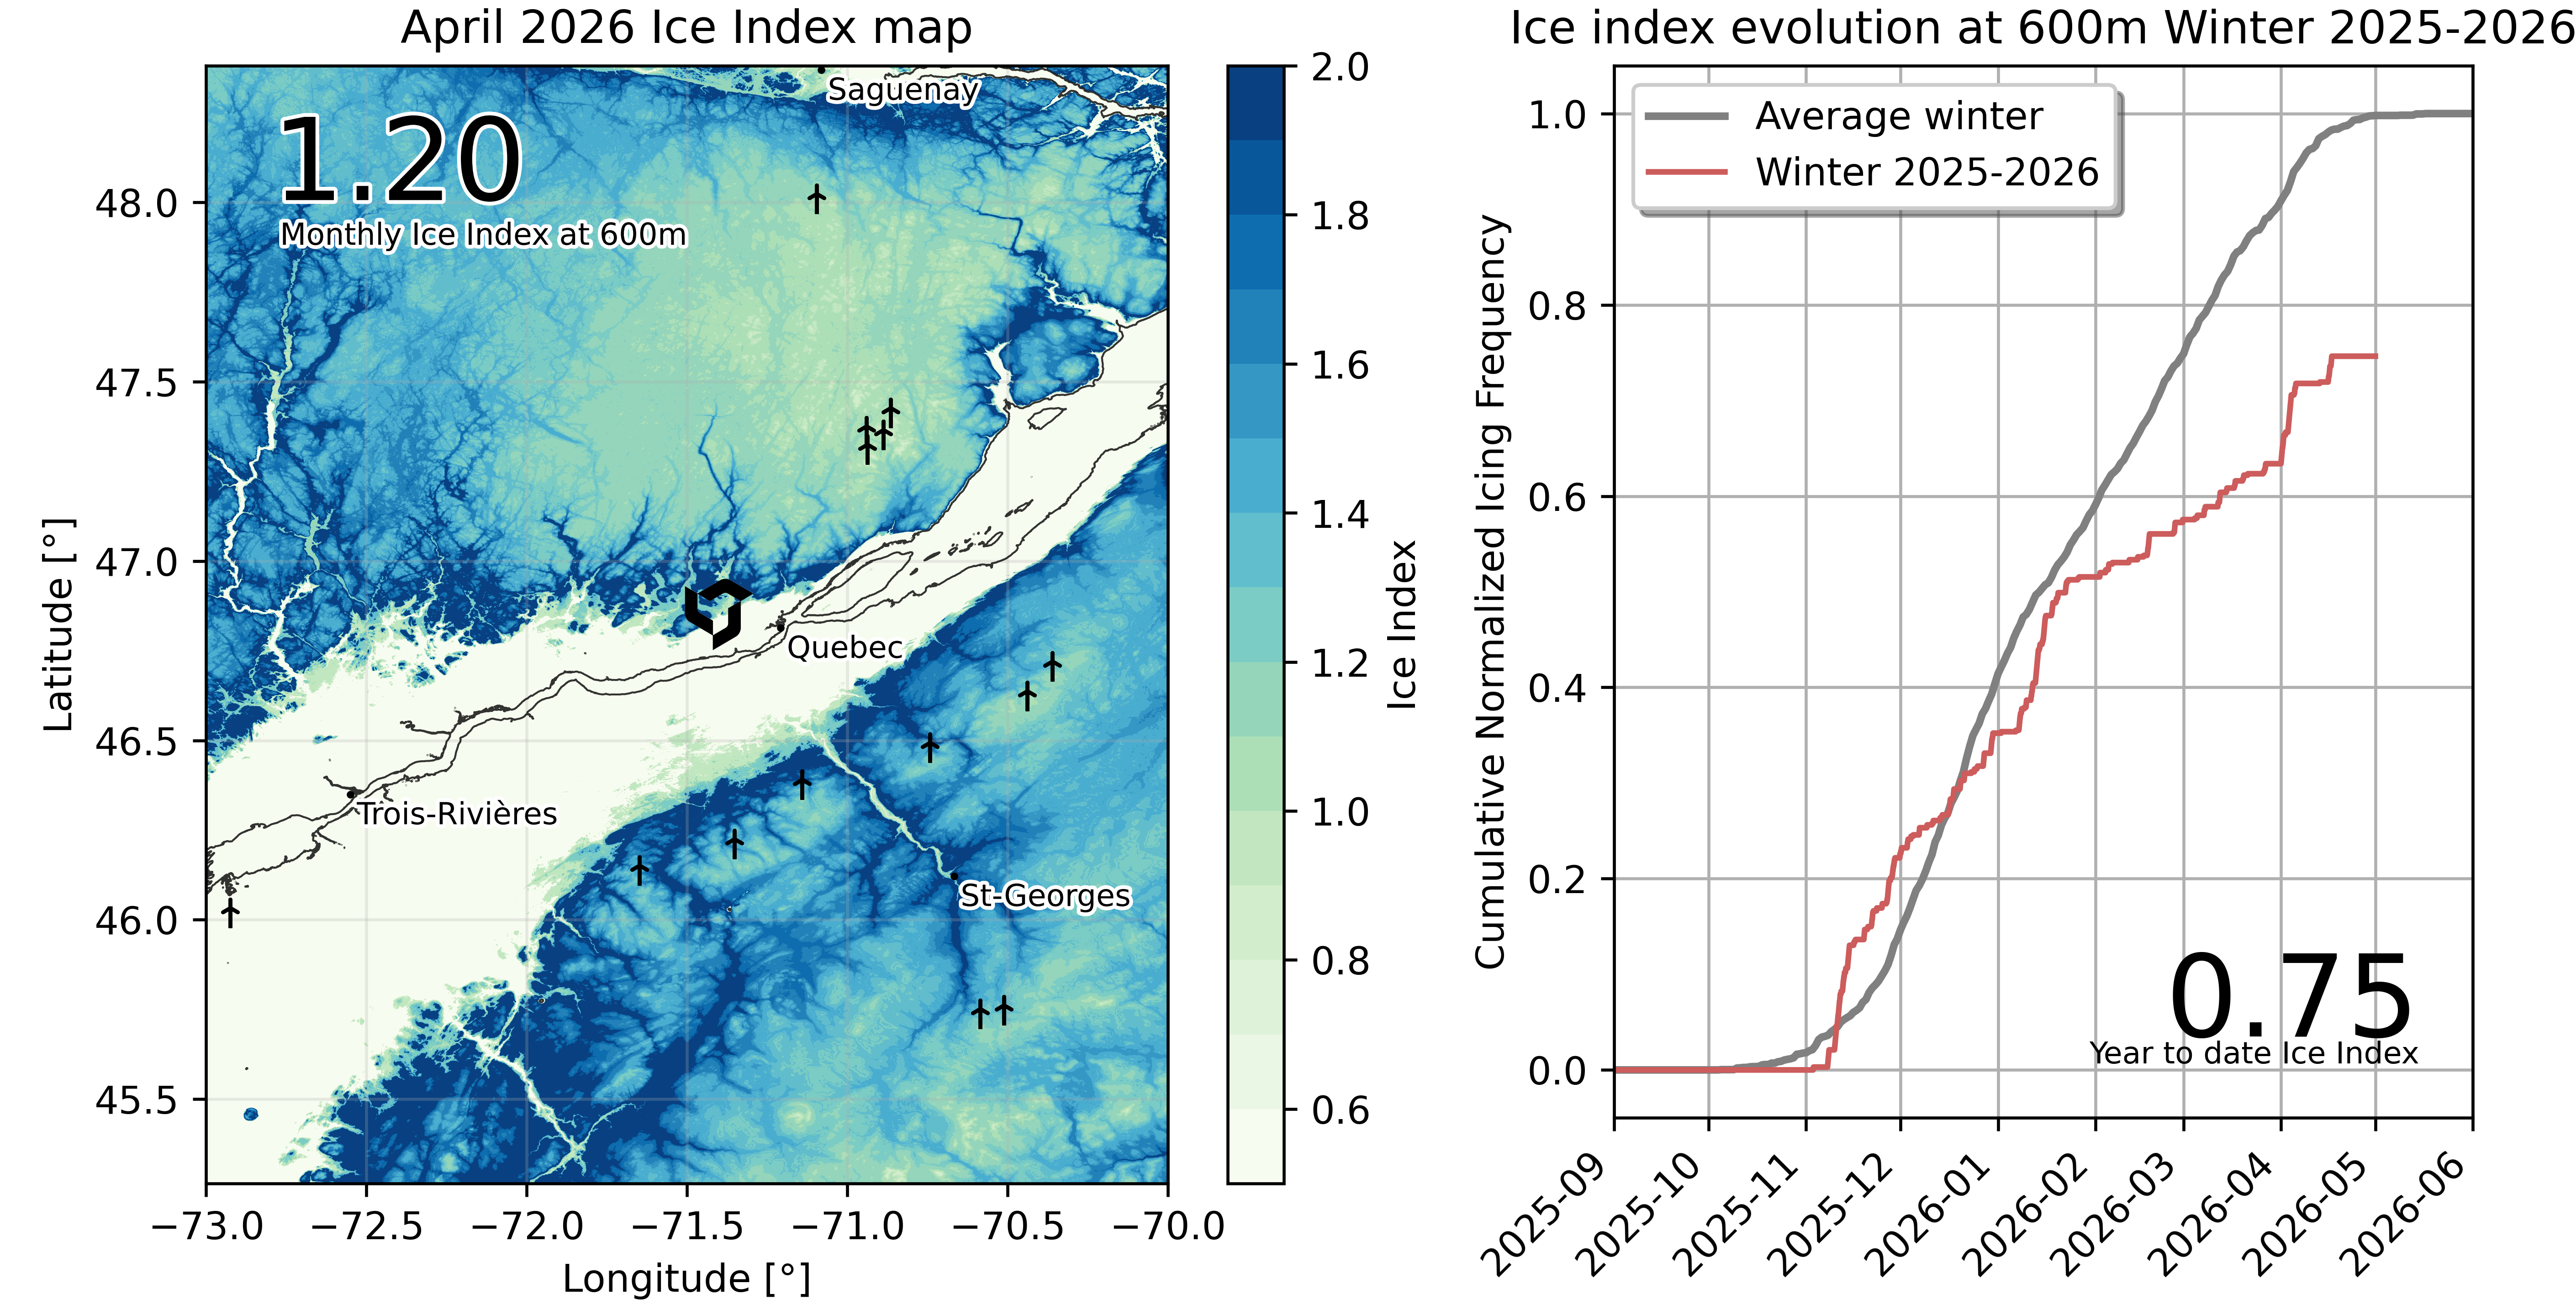
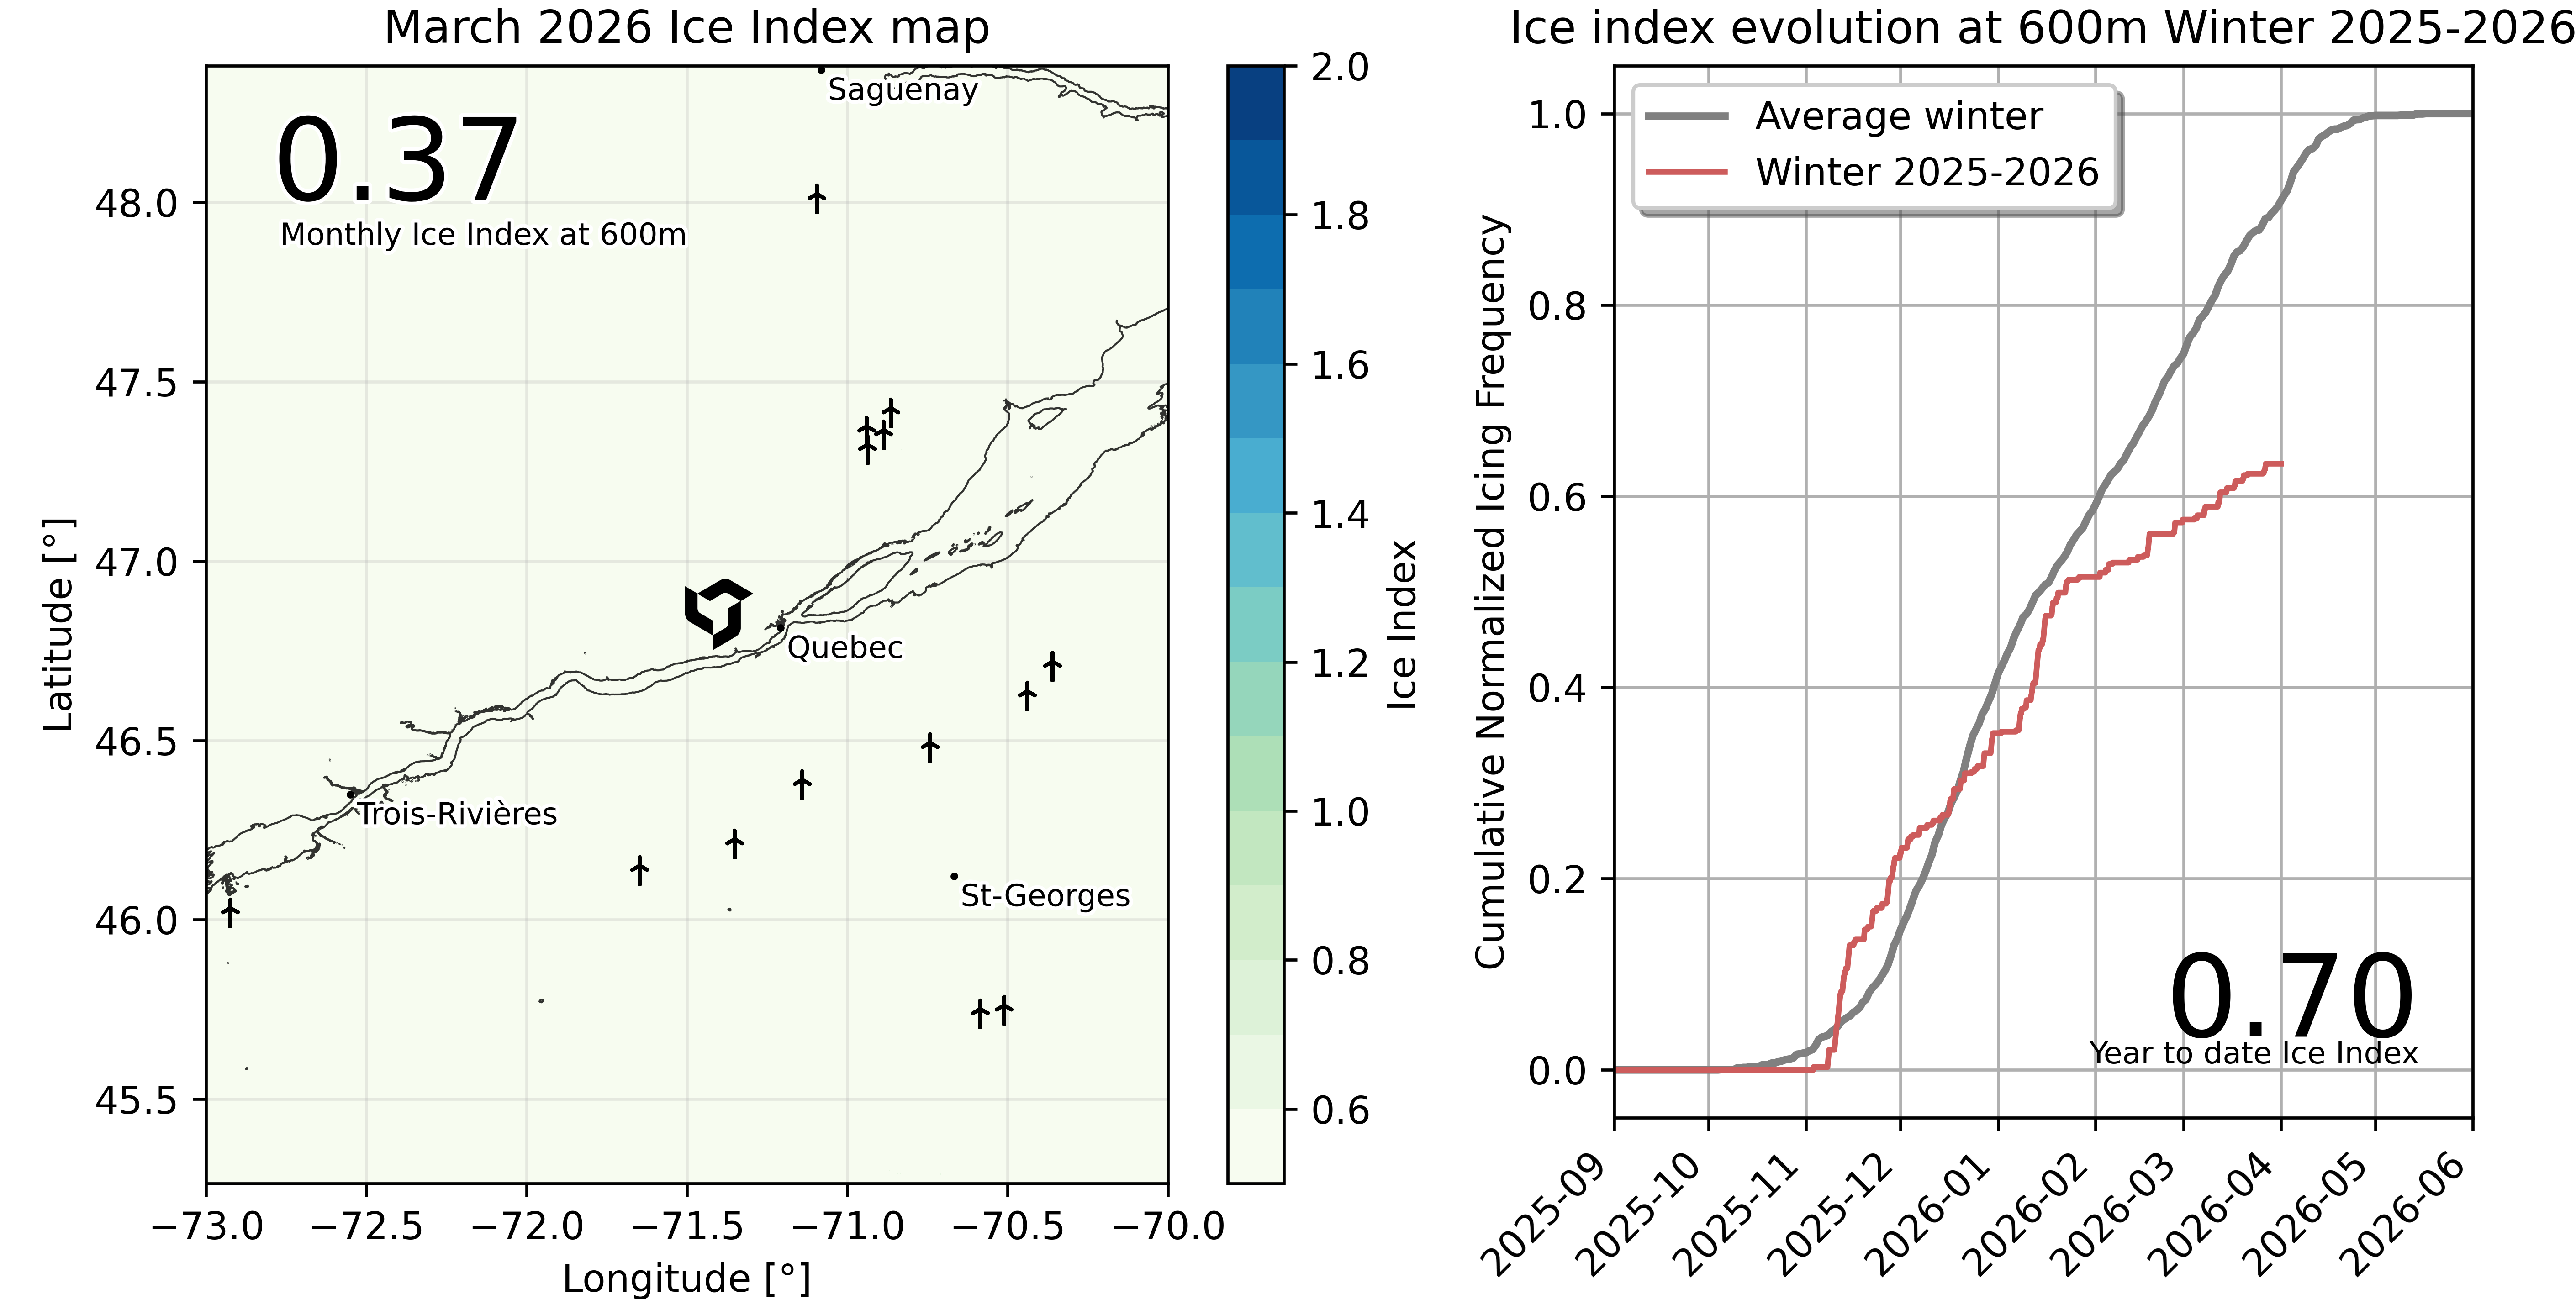
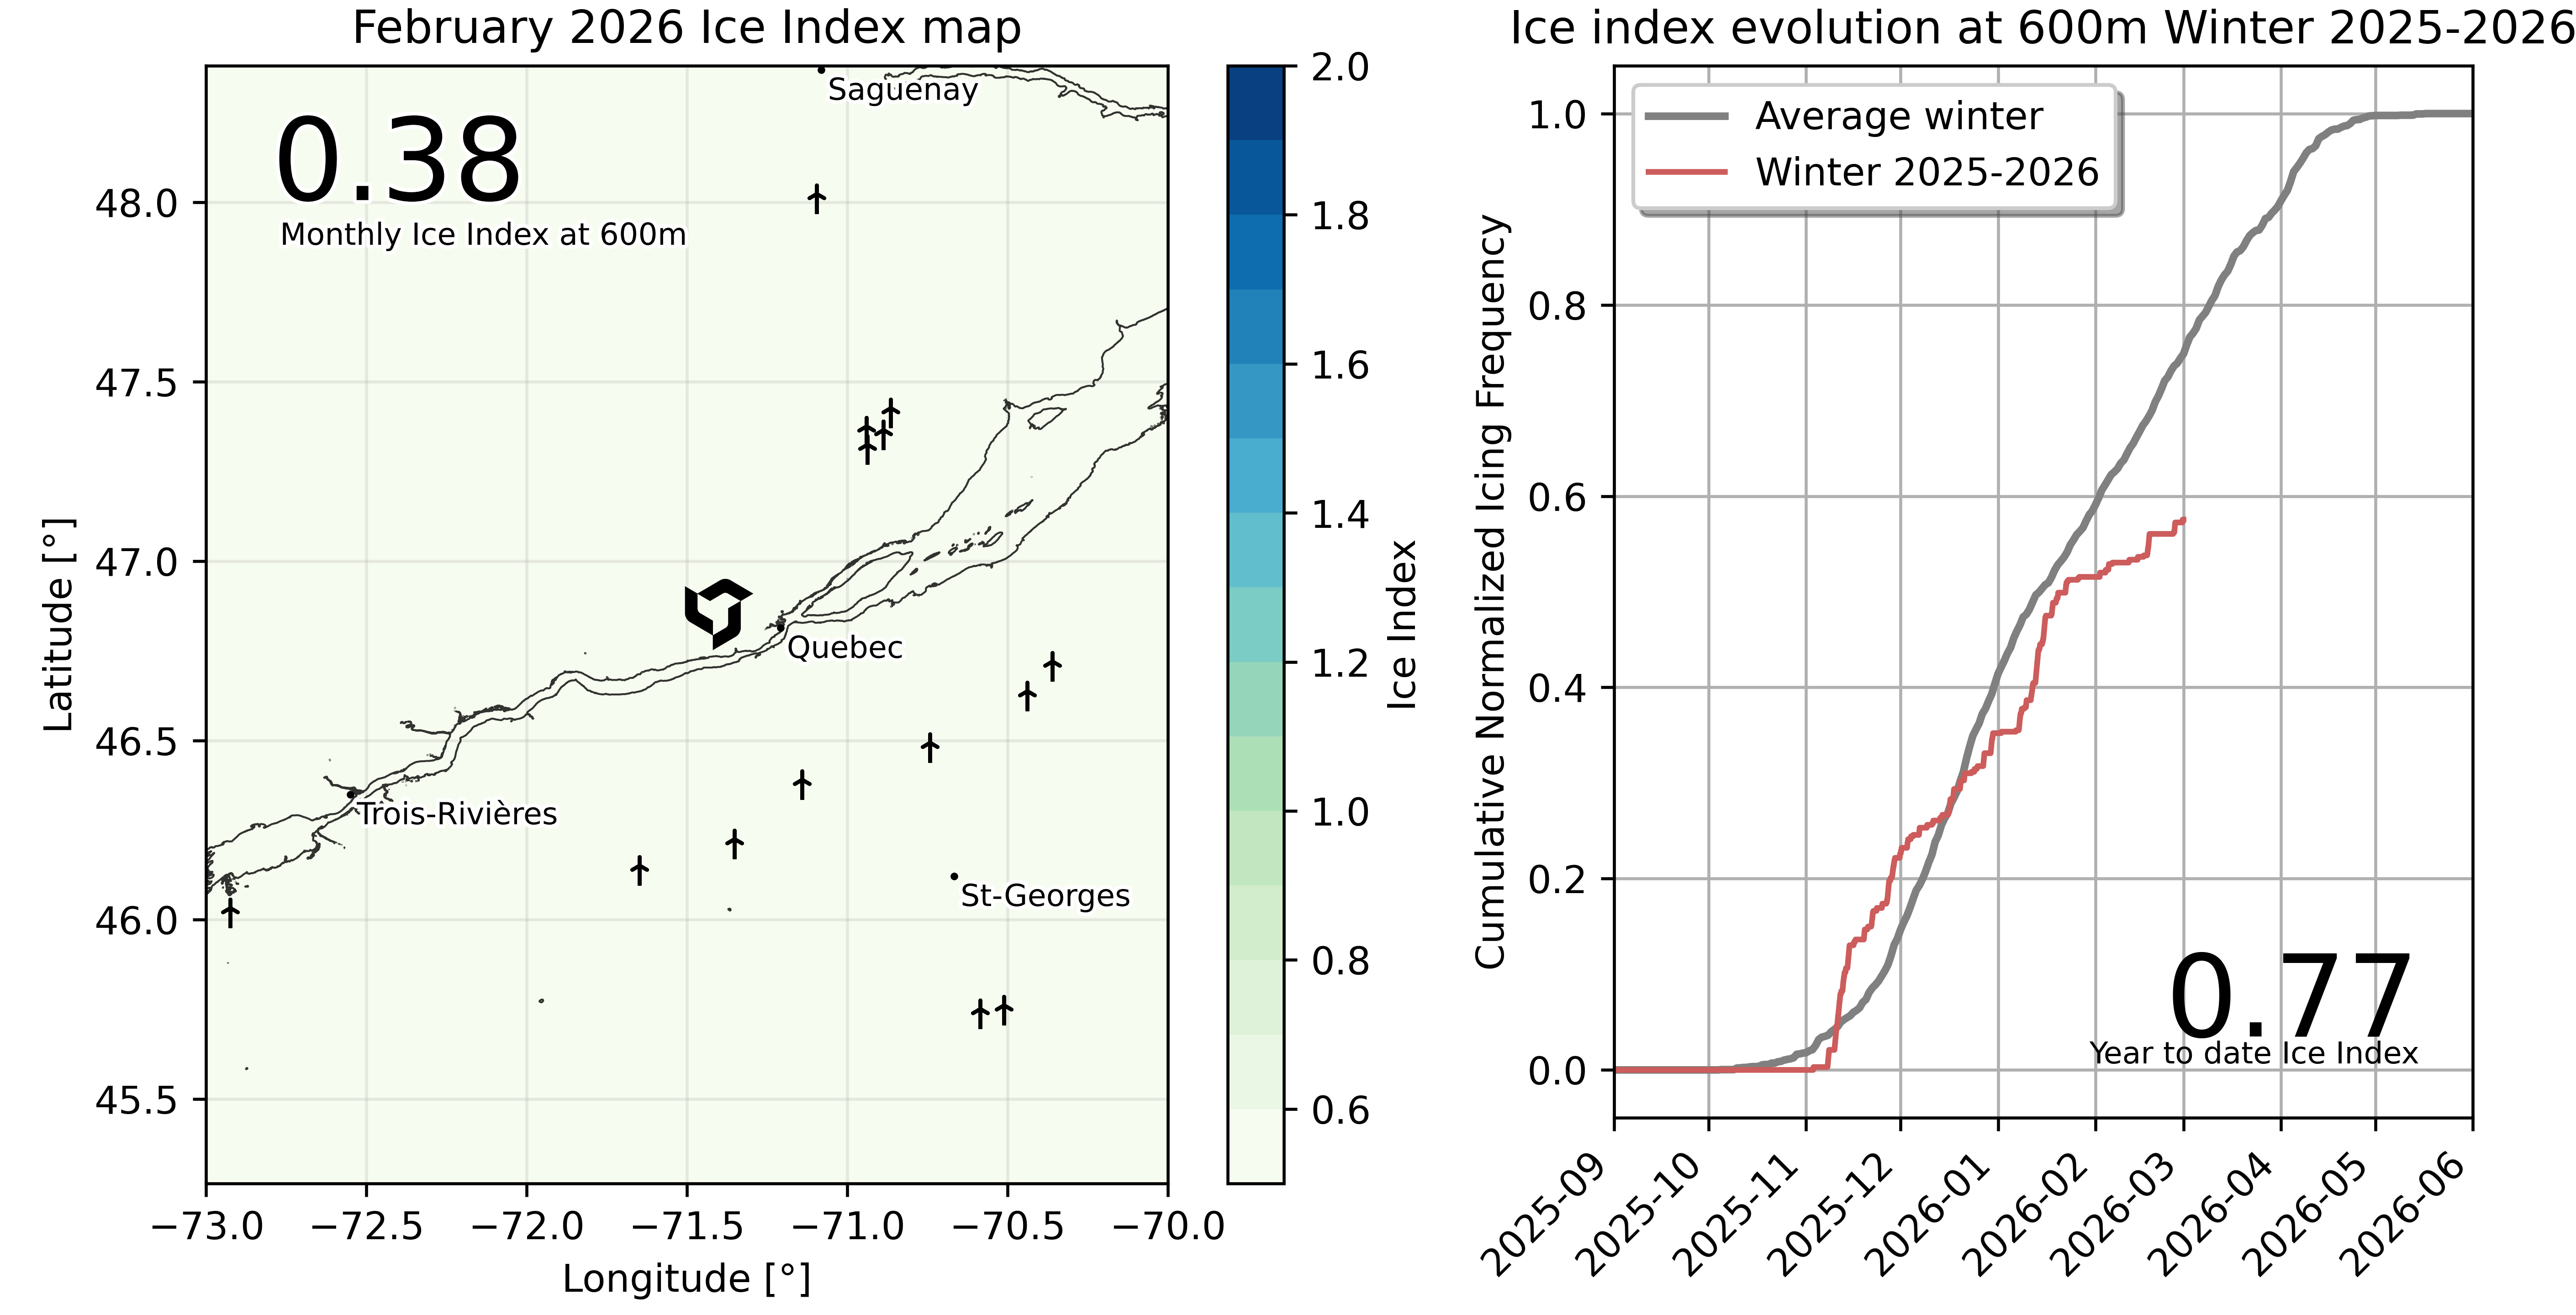
Every month we publish a normalized icing index for the region around Quebec City. Operators use it to benchmark the performance of their icing solutions, calibrate AEP forecasts, and justify investment in icing mitigation.
How the index is built.
The Ice Index is a single comparable number, built on years of meteorological measurements, on-field validation, and statistical normalization.
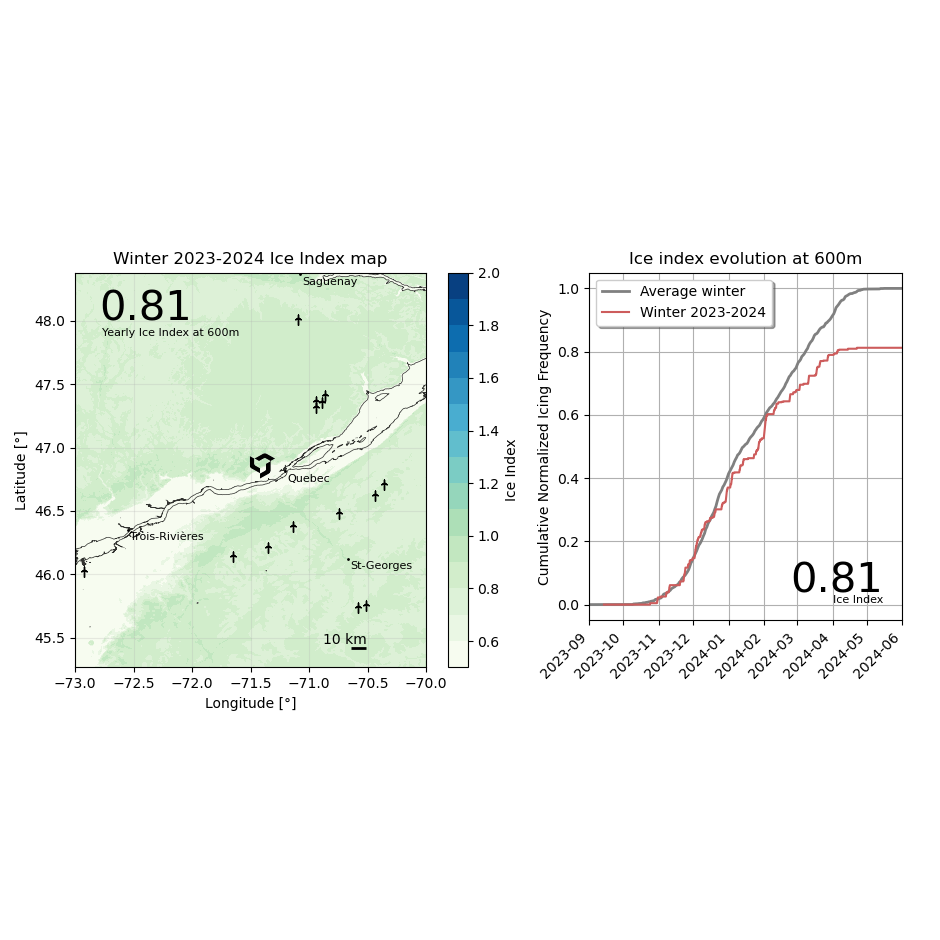
Every month, since 2023.
Click any month to open its full report. Archive goes back fourteen winters, the deepest publicly available icing dataset for Eastern Canada.


Commission an
Ice Index for
your region.
We publish the Québec City Ice Index monthly. For other regions (New England, the Maritimes, Northern Europe, the Alps) we build and deliver a custom monthly index on commission, with much higher resolution.
Typical engagements are annual subscriptions for operators with assets in a specific area; we calibrate the model with your sensor data if you have it.
Common questions.
Plan winter, not just survive it.
Subscribe to the Québec Ice Index, or commission one for your own region. We respond within 24 hours.